
SE Oklahoma Regional Study
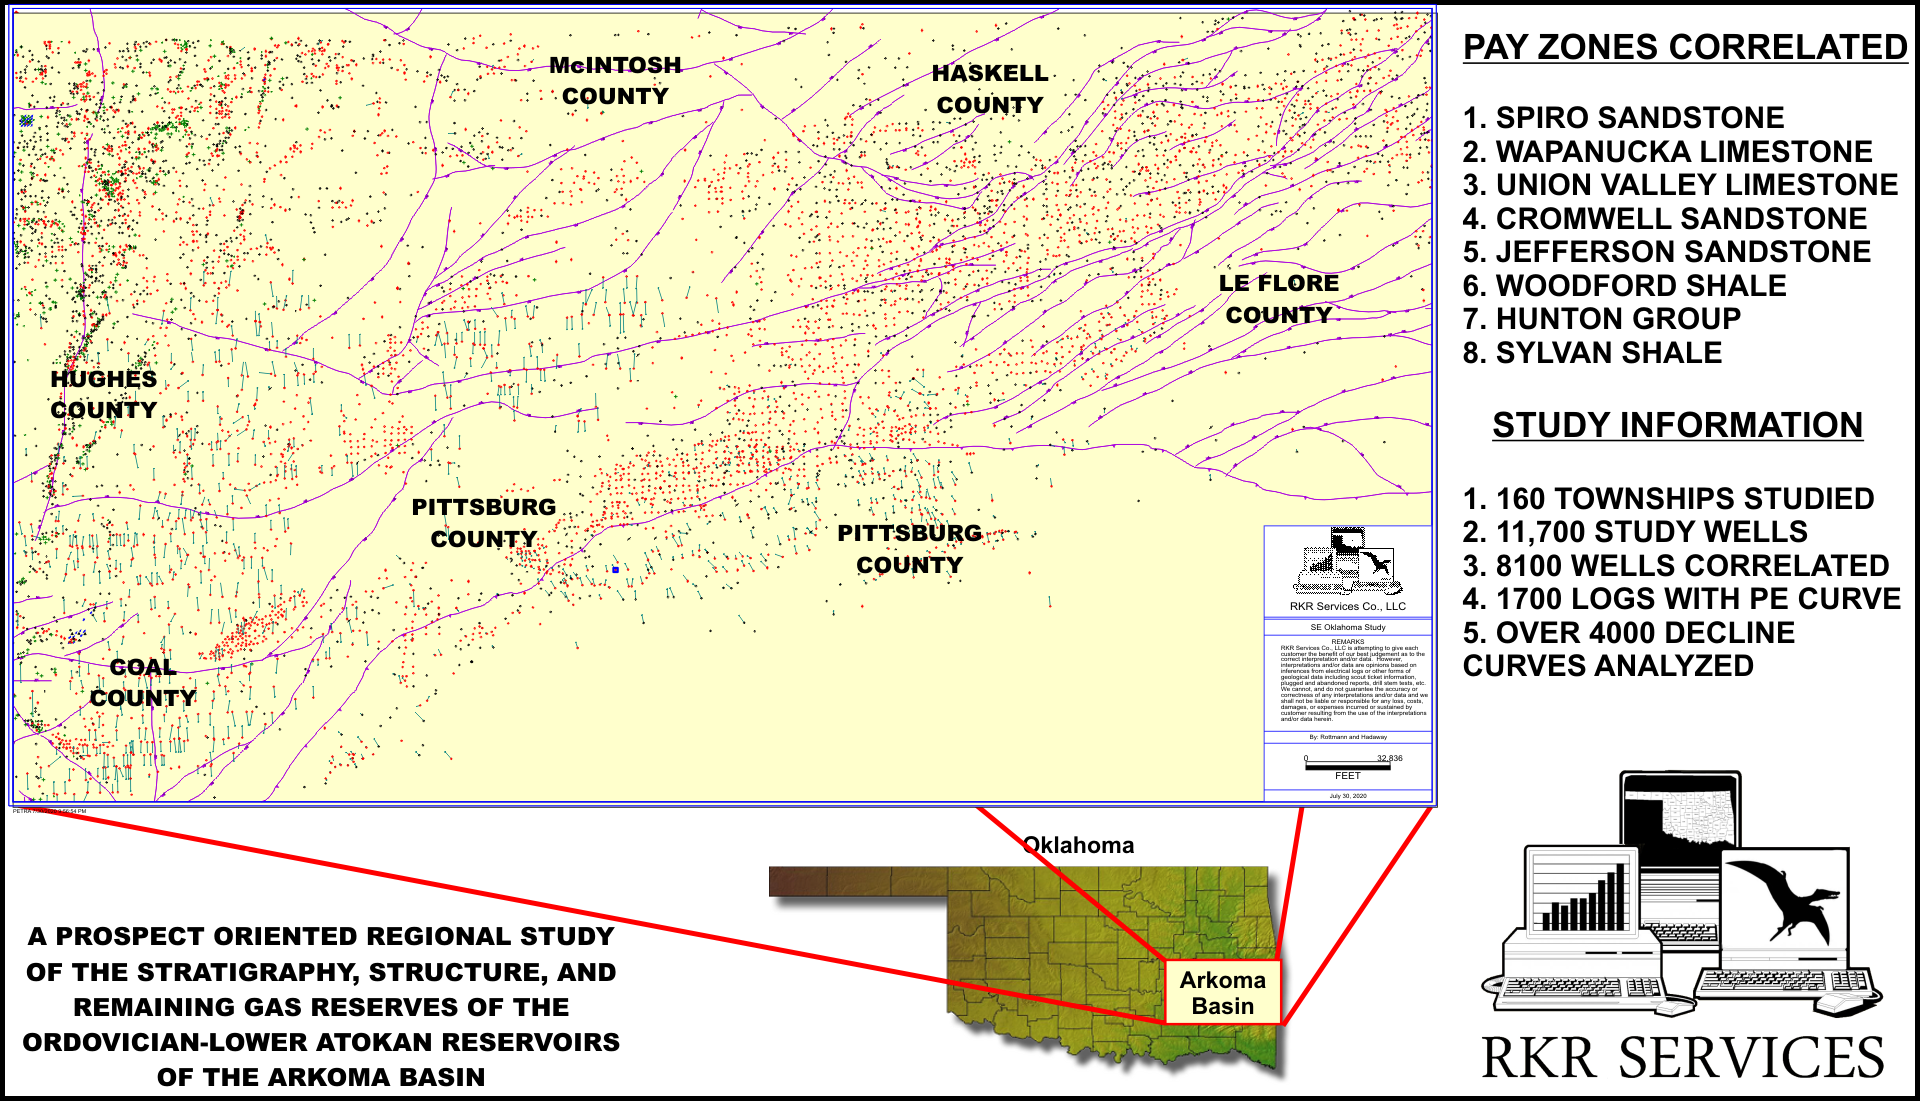
RKR Services is a geologic consulting company that was established in 2007. Our primary specialty is in preparing prospect oriented regional studies. Our purpose is to provide the Oil and Gas Industry a high quality, low cost evaluation of large highly productive region. This study, that RKR is currently offering, is a regional study of the stratigraphy, structure, and remaining gas reserves of the Ordovician-Lower Atokan resrevoirs of the Arkoma Basin.
These reservoirs of the Arkoma Basin were chosen by three significant criteria:
- The region is predominatly gas productive and whose prices are not significantly tied to the price of oil,
- These reservoirs off a significant completion to total wells drilled ratio. The completion rate for these reservoirs is over 70%.
- This area was chosen because there are a significant number of wells nearing their economic limit. RKR believes that a detailed study of remaining gas reserves could be tremendously useful to operators interested in gas prospects, infill drilling or increased density drilling opportunities and in the purchasing of mineral interests.
RKR Services started this study in the summer of 2017 and currently has more than 6 ½ man years of time involved in the study. The study comprises an area of 160 townships over 7 counties in se Oklahoma. There are a total of approximately 11,700 wells that penetrated the Spiro and of these RKR has over 8100 raster logs that were used for the correlation.

As mentioned previously, this study is comprehensive and thorough. RKR is a geological consulting firm who recognizes the type of information a client may need when evaluation a property or prospect.
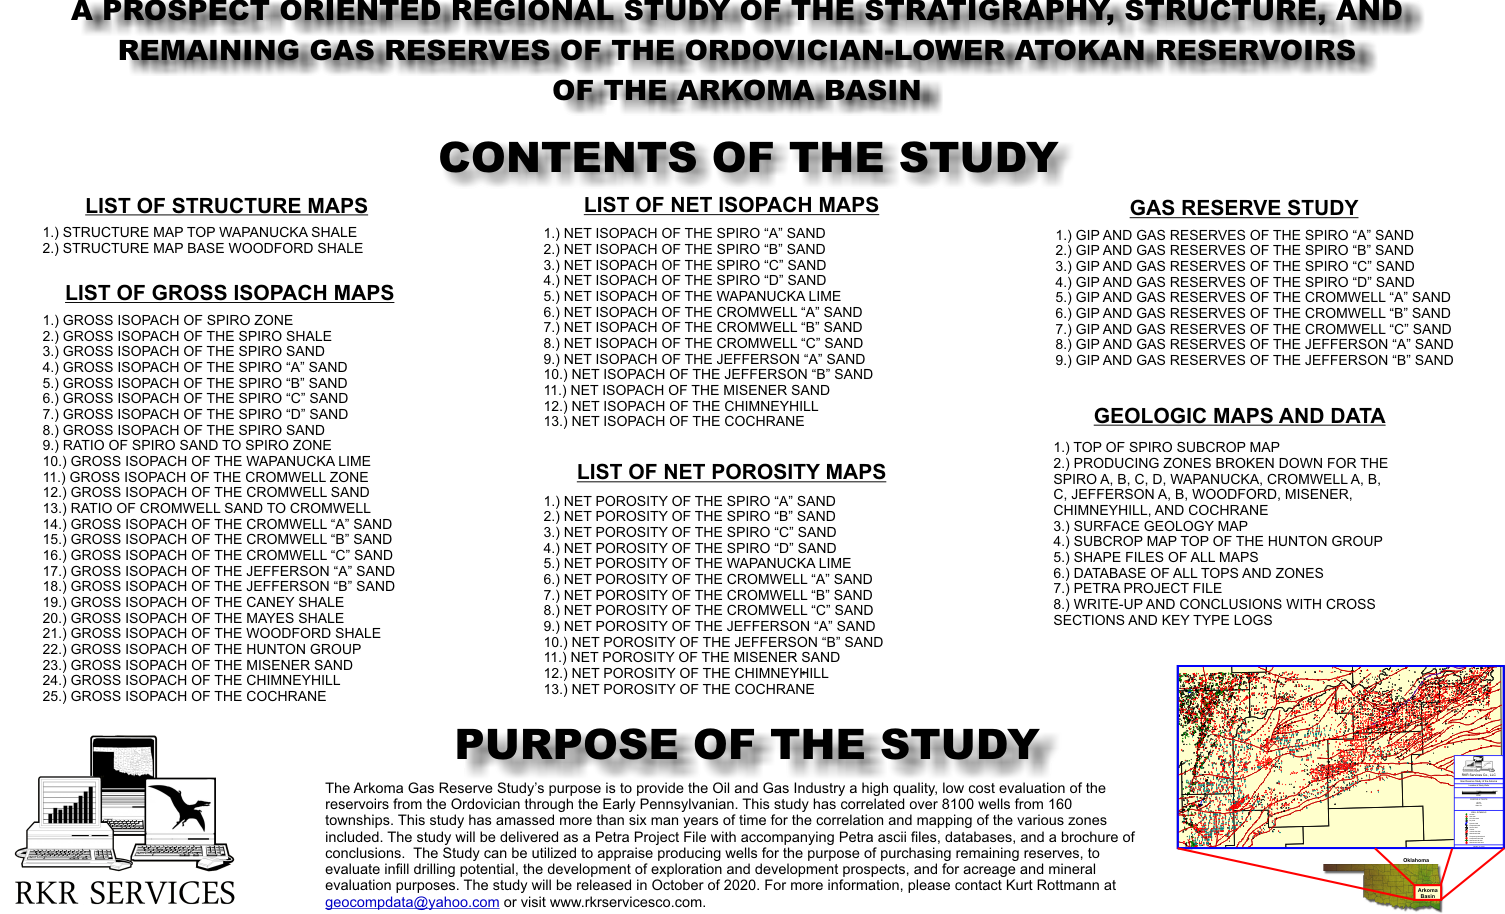
This figure illustrates those maps and data that will be incorporated into the study. The study will be released as a Petra Project file. The Overlay file for this project will also be included which contains all of the layers of maps and data shown here. The tops and zone isopach data will also be in the Project file. Databases of the cross sections and type logs will also be included. This effort on RKR’s part to supply the study in this format should make it immediately usable for the client.
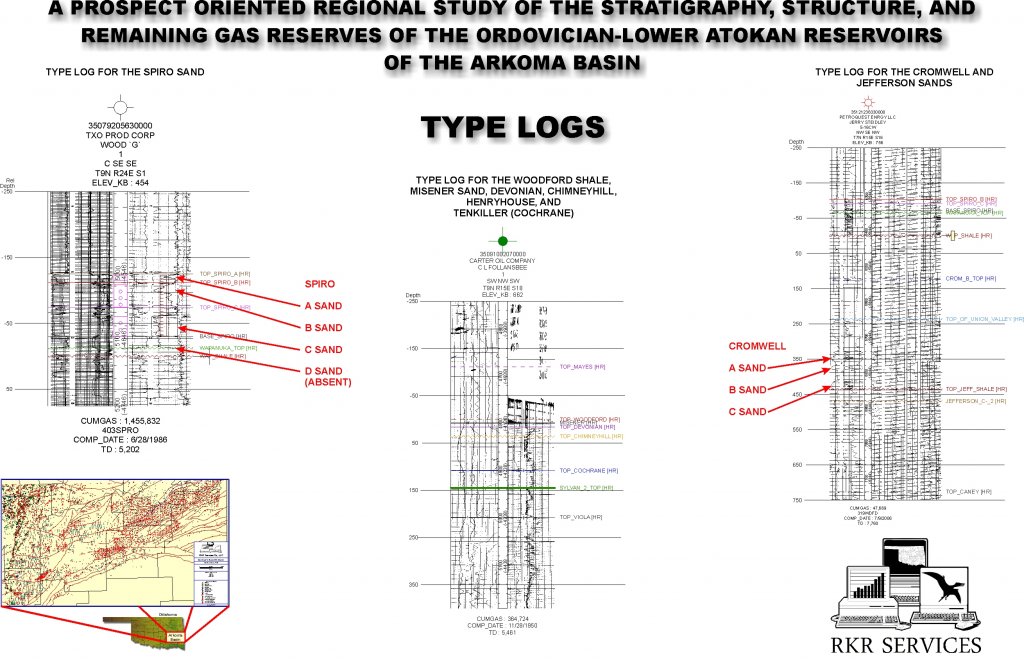
The correlation of several of the major pay zones from this study has yielded some surprising if not expected results. These results are the further understanding of the geologic framework for these payzones.
For example, the type log on the left breaks down the detailed correlation of the Spiro Sand zone into 4 individual units; the Spiro A, B, C, and D sands. The study for these sands contains the gross isopach, gross sand isopach, gross porous sand, and net pay sand for each of these mappable members of the Spiro. All previous work has treated these individual units as one sand and mapped that sand accordingly. By realizing that the Spiro consists of 4 readily identifiable sands, these sands can be mapped individually which then incorporates their environment of deposition, depositional geometry and their individual gas reserves.
The center type log is that of the Mississippian , Woodford Shale, and Hunton Group. RKR incorporated 42 core and sample descriptions from Dr. Thomas Amsden’s previous studies of the Hunton Group and carried those correlations to over 1900 Hunton Group penetrations. This study now recognizes the lateral extent of the Cochrane/Tenkiller Formation, the Clarita Formation, the Henryhouse Formation, and the Devonian Bois D’Arc and Sallisaw Formations. Net porosity maps have been created for each of these formations where appropriate.
The type log on the right is that for the Cromwell Sand. The Cromwell has been broken down into 3 distinct units which, as in the case of the Spiro, has mapped the gross sand, the gross net sand, and the net pay sand. Gas reserves analysis has been performed on these three members also.
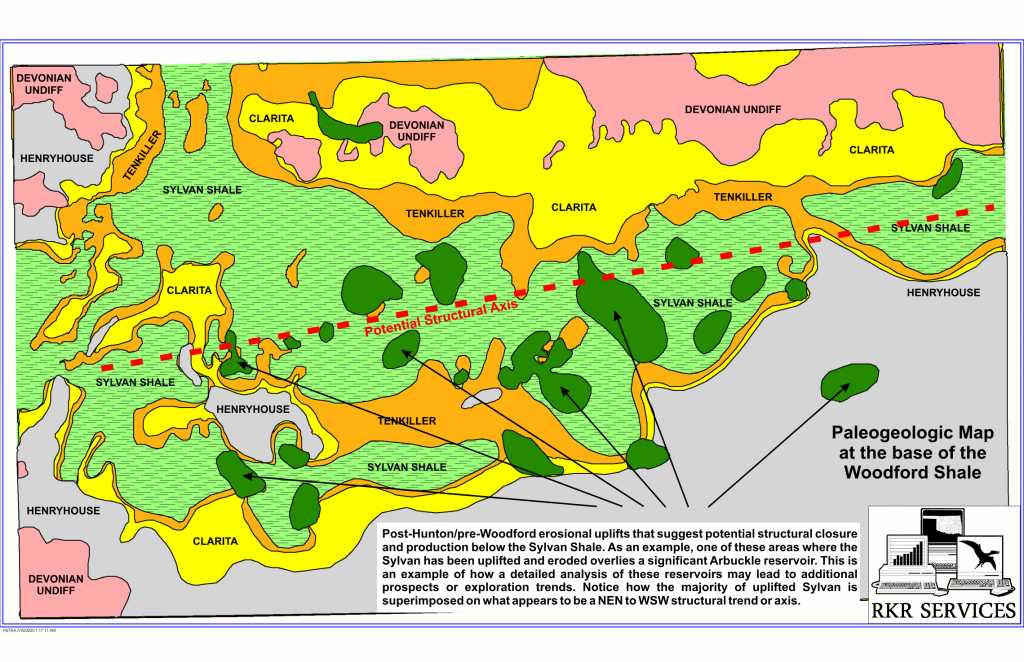
Unexpected results and interpretations very often occur with the the type of detailed correlations that RKR incorporate into its study. This figure is a good example of one of those unexpected resul. This is a paleogeologic map at the base of the Woodford Shale. The various formations of the Hunton Group are identified and this figure shows their areal extent. Of significance is theat part of the map where the Hunton Group is completely eroded and the Sylvan Shale is exposed. What becomes readily apparent is an east north east to west south west orientation of this erosional feature/ A structural axis can be interpreted due to the thickening of the Hunton Group both to the north of this feature and to the south. Furthermore, our isopach of the Sylvan Shale suggests multiple areas where thee Sylvan becomes extraordinarily thin possibly due to local structural uplift. An overlay of these Sylvan thins upon this paleogeologic map reveals that almost all of the Sylvan thins occur in and around this structural axis feature.
From an exploratory aspect, what is significant to know is that the Cambrian Arbuckle Group is an important producer under one of these Sylvan thins. This begs the possibility that these Sylvan thins may overlie significant reserves from reservoirs beneath it.
This regional study has discovered several other previously unknown structural and stratigraphic relationships from similar types of interpretations of the mapping of these reservoirs.

This study has recognized the segregated characteristics of the Jefferson, Cromwell, and Spiro sands. These individual sands have their own geometric configuration. This figure illustrates the gross sand isopach of one of those sands. The sand source is from the north and the depositional environment is that of an incised valley-fill channel system with multiple nw to se channles. This zone is extremely productive with most of the wells having been drilled in the 1960’s, 70’s, and 80’s. What this suggests is that many of these wells are at or near their economic limit.
In conjunction with the detailed stratigraphic analysis is an equally detailed structural evaluation. Of importance to this illustration is the superposition of the faults, as interpreted from the structure map, over this series of productive channels. What becomes readily apparent is that the faults create compartments of reservoir sand. Because of the amount of throw from these faults, each of these sand compartments become isolated reservoirs.
RKR has identified each of these compartments and calculated a gas in place value for the net sand of the reservoir. By knowing what the reservoir has produced, remaining reserves can be calculated. This gas reserve analysis compliments the stratigraphic and structural portion of this study and which separates the quality of this study from most other studies that have been offered by the industry.
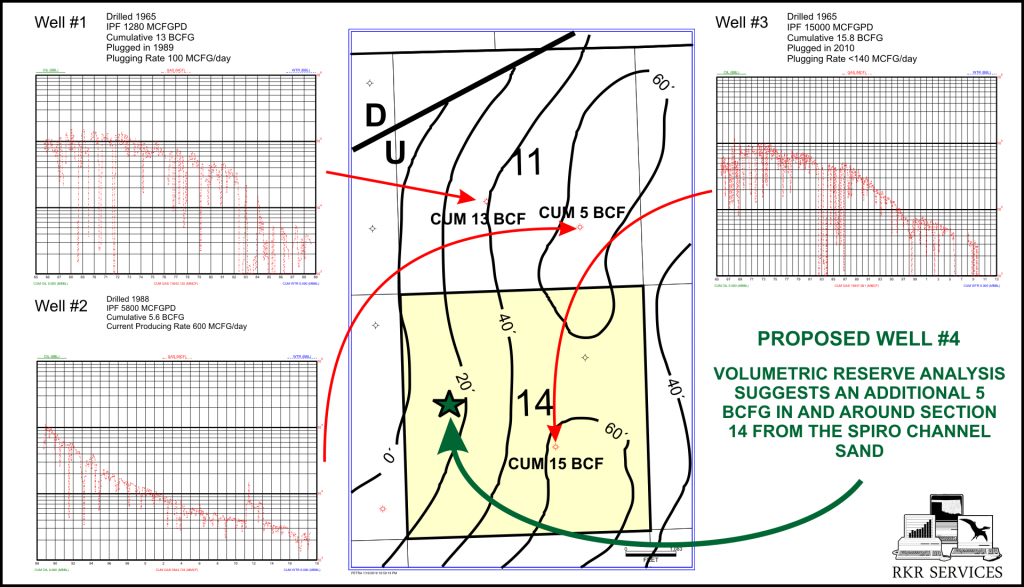
One of the major components to this study is the gas reserve analysis. As can be observed by the preceding section, accurate mapping of the sand trends and the incorporation of interpreted faults creates ample opportunity for evaluating potential isolated fault trapped reservoirs. These reservoirs will be evaluated individually for remaining gas reserves. As an example of this meth0d consider this figure. Well #1 was drilled in 1965 and produced from one of the mapped sands. It had an initial potential flow of 1.28 MMCFGPD. The decline curve for this well is shown in the upper left of the figure. In 1989, the well was plugged after producing 13 BCFG. The well was producing at a rate of 100MCFGPD when it was plugged.
In 1988, an increased density well was drilled in the se/4 of the same section. Well #2 was completed in the same sand that produced from well #1. The well had an IPF of 5.8 MMCFGPD. Currently, the well is still producing at a rate of 600 MCFGPD and has a cumulative production of 5.6 BCFG.
Well #3 was also drilled in 1965 and perforated the same sand as well #1. This well had an IPF of 15 MMCFGPD. The production curve is shown in the upper right of the figure. The well produced until 2010 when it was plugged. It had a cumulative production of 15.8 BCFG and was plugged at a rate of <140 MCFGPD with no water.
RKR’s volumetric gas in place calculations for these two sections is approximately 42 BCFG. Since 35 BCFG has been produced, this suggests that a total of 7 BCFG or net available gas reserves of 5-6 BCFG could be produced from a new location in the w/2 of section 14.This is an excellent example for the potential of this study. One of the primary factors in selecting the Arkoma Basin as a study area is the age of the producing wells. A great percentage of the wells are nearing the end of their economic life. Acreage that has potential for increased density, developmental potential, new prospects, or mineral purchases can be acquired by purchasing existing production. A client can gain entry into a prospect or project by this manner rather than expending funds for leasing. As long as the production continues the acreage can be held and the client can recoup original purchase price through gas production.
Reserve analysis of the Jefferson, Cromwell and Spiro sands is the necessary compliment to this study for a potential client to make a detailed and thorough study of this area.
